Download presentation
Presentation is loading. Please wait.

1
Economic Indicators

2
Key Economic Indicators
Macroeconomics looks at the big picture, the performance of our economy as a whole. It measures various symptoms of how healthy the national economy is. These measurements are called Key Economic Indicators: GDP, CPI and Unemployment rate.

3
Key Economic Indicators: GDP
Nominal Gross Domestic Product (GDP): is the total market value of all goods and services produced in a nation over a specific period of time, usually a year. Formula for calculating GDP: GDP=C+I+G+Xn C= Consumer Spending I= business investment G= Government Spending XN=exports-imports
: is the total market value of all goods and services produced in a nation over a specific period of time, usually a year. Formula for calculating GDP: GDP=C+I+G+Xn. C= Consumer Spending I= business investment. G= Government Spending XN=exports-imports.")
4
Key Economic Indicators: GDP
Measuring GDP Continued: Net exports are included because the money other countries spend on our exports adds value to our economy, while the money we spend on goods imported from other countries takes money out of our economy. Economic Growth: If the nation’s GDP increases, you can tell that the economy is growing, unless the increase was due to inflation, or an increase in prices.

5
Key Economic Indicators: GDP
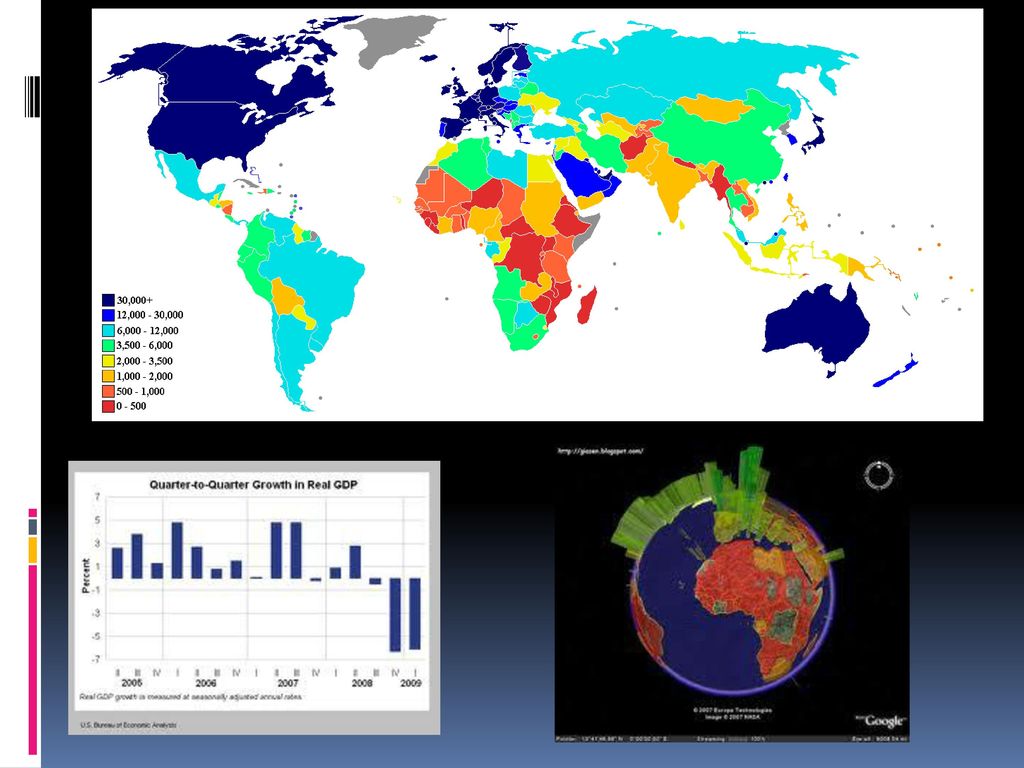
Real GDP: To get an accurate measurement of how much the economy is growing, you need real GDP by using a price index to adjust for inflation. Nominal GDP: The GDP figure before adjusting for inflation. A nation’s rate of economic growth is the % change in its real GDP from 1 year to the next. If Nominal GDP increases by 6% and the inflation rate in the same period was 4% , then we know that there was a 2% increase in Real GDP.

7
Key Economic Indicators: Consumer Price Index
Inflation refers to an increase in the average price of goods and services bought by the average consumer. When prices go up, we get less for our money, so that we may be spending more without actually buying more than we did before. We lose buying or purchasing power.

8
Key Economic Indicators: CPI
Less often, a decline in the GDP might be caused by deflation. Deflation is a decrease in the average price of goods and services. Both inflation and deflation are harmful for the economy. wii/afterwwi.pdf

9
Key Economic Indicators: CPI
Consumer Price Index: statistical series that tracks monthly changes in prices paid by consumers for a representative “basket” of goods and services. The market basket consists of 364 commonly purchased goods and services. Formula: CPI: add up the total price of a “market basket” of typical items bought by an average family in a month. CPI= Cost of today’s market base COST OF MARKET BASKET IN PREVIOUS YEAR X 100

10
Key Economic Indicators: CPI
For example, if the market basket cost $960 in the year 2006 and $1,000 in the year 2007, the change in the CPI for the period , is calculated by....

11
Key Economic Indicators: CPI
CPI= = 1.04x 100=104 960 This is all you are required to know how to do. However, to calculate the inflation rate is a little more complicated. To find the percentage change, we would divide the change in CPI by the beginning value of the CPI.

12
Inflation Rate ( ) = 40 = = 4%
+%3D+40+%3D+%3D+4%25.jpg "Inflation Rate ( ) = 40 = = 4%")
13
Key Economic Indicators: CPI
Inflation occurs when the money supply in an economy increases too quickly. Governments often increase the money supply in order to encourage consumer spending and promote economic growth. If prices increase but the economy does not grow, stagflation occurs. High inflation hurts wage earners, unless their employment contracts include a cost of living adjustment, which increases wages to keep up with inflation.

14
Key Economic Indicators: Unemployment
Unemployment Rate: % of people who are unemployed. An economy with a low unemployment rate is usually healthy and growing, because it is not wasting its labor resources. More workers means more production and more consumption. Calculate Unemployment Rate: Count only those who are actively looking for jobs and are able to work. Labor Force: Sum of persons age 16 and above who are either employed or actively seeking employment. Excludes members of the military, those confined in jail, and those in mental health facilities, children, retired people, full time students, stay at home parents, people who have given up looking for work.

15
Key Economic Indicators: Unemployment
To be calculated must be part of the labor force- either you have a job or are looking for one. Unemployment = number of people looking for work Rate number of people in labor force X 100

16
Who keeps up with this and who cares?
There is a government agency that keeps up with these statistics. They employ statisticians and economists to keep up with this information and report the findings. Fun Economics career opportunity!

17
Key Economic Indicators: Unemployment
Not all unemployment is downturn of economy. 4 different types of unemployment 1. Structural unemployment: Occurs when the skills of the labor force do not match those that employers need. To reduce this must either relocate where the skills are needed or learn new skills. ex: factory workers are unemployed because factories are closed.

18
Key Economic Indicators: Unemployment
2. Frictional unemployment: occurs when people decide not to take a particular job because they are looking for a better job that suits their talents, needs and desires. ex: an unemployed office worker might be able to find a job in a grocery store, but would rather wait until he or she can find a job that pays better and uses his or her skills and experience.

19
Key Economic Indicators: Unemployment
3. Seasonal unemployment: Affects many people whose job depend on the weather. ex: snow plow driver can find work only in winter. 4. Cyclical unemployment: occurs because of a downturn in the economy. Economies go through a cycle of good times and bad times, growth and recession. During good times, companies hire workers and production goes up. If consumer demand goes down, companies cut production result in loss of many jobs.

20
Show what you know In year 1, the cost of a market basket of goods was $ 850. In year 2, the cost of the same market basket was $ 880. What was the CPI for year 2? What was the inflation rate? A nation has 100,000 employed people, 10,000 unemployed people, and 5,000 people who have given up looking for jobs. What is the size of its labor force? What is its unemployment rate?

Similar presentations


 measures the dollar value of all goods and services produced in the U.S. economy in.>")


 Unit 2: Measurement of Economic Performance (12-16%)>")

 An increase in real Gross Domestic Product (GDP)>")


