Download presentation
Presentation is loading. Please wait.

2
A Statistical Application of Principal Components to the Sport of Cricket

6
Indian Premier League (IPL) is a professional Twenty20 championship cricket league in India that has become very popular. Twenty20 is the latest format of cricket, and a typical match lasts about 3.5 hours. Beginning in 2008, IPL had completed its fifth consecutive season by May 2012. For the 2012 competition there were 9 competing teams: Royal Challengers Bangalore, Rajasthan Royals, Pune Warriors India, Mumbai Indians, Kolkata Knight Riders, Kings XI Punjab, Delhi Daredevils, Deccan Chargers, and Chennai Super Kings.

7
Cricket Game Video:

8
Important Batting Variables: Runs, Batting Average, Batting Strike Rate, Fours, Sixes, Half-Centuries. Important Bowling Variables: Wickets, Bowling Average, Ecomomy Rate, Bowling Strike Rate

9
Runs: The total number of runs scored by a player in the IPL 2012 season. Higher values indicate stronger performance. Batting Average (Ave): The total number of runs a batsman has scored divided by the total number of times he has been called out in the IPL 2012 season. Higher values indicate stronger performance. However, for a batsman with several “not out” cases, this number overrates the batsman, which is a weakness in this measure, and this is why it should not be used as the only variable for batting performance analysis. Batting Strike Rate (SR): The Batting Strike Rate is defined as the number of runs scored per 100 balls faced by a batsman in the IPL 2012 season. Again, higher values indicate stronger performance. An aggressive batting style is always helpful in shorter versions of limited-overs cricket matches like Twenty20. However, a high strike rate accompanying a low batting average is not desirable.
: The total number of runs a batsman has scored divided by the total number of times he has been called out in the IPL 2012 season. Higher values indicate stronger performance. However, for a batsman with several not out cases, this number overrates the batsman, which is a weakness in this measure, and this is why it should not be used as the only variable for batting performance analysis. Batting Strike Rate (SR): The Batting Strike Rate is defined as the number of runs scored per 100 balls faced by a batsman in the IPL 2012 season. Again, higher values indicate stronger performance. An aggressive batting style is always helpful in shorter versions of limited-overs cricket matches like Twenty20. However, a high strike rate accompanying a low batting average is not desirable..")
10
Fours: The total number of boundaries (fours = four runs) made in the IPL 2012 season by a batsman. Higher values indicate stronger performance. Scoring boundaries is a great way to increase the number of runs without wasting resources, and it helps increase the batting average and strike rate. Sixes: The total number of sixes (= six runs) made in the IPL 2012 season by a batsman. As before, higher values indicate stronger performance. Scoring sixes usually enhances team scoring momentum and can also diminish the momentum of the opposing bowler. HF = (2 x Number of Centuries) + Number of Fifties. Higher values are indicative of exceptional performance, and it is always advantageous to build partnerships and play longer innings in any cricket format. There were only six centuries for the IPL 2012 tournament.
 made in the IPL 2012 season by a batsman. As before, higher values indicate stronger performance. Scoring sixes usually enhances team scoring momentum and can also diminish the momentum of the opposing bowler. HF = (2 x Number of Centuries) + Number of Fifties. Higher values are indicative of exceptional performance, and it is always advantageous to build partnerships and play longer innings in any cricket format. There were only six centuries for the IPL 2012 tournament..")
11
Principal Axis Theorem

14
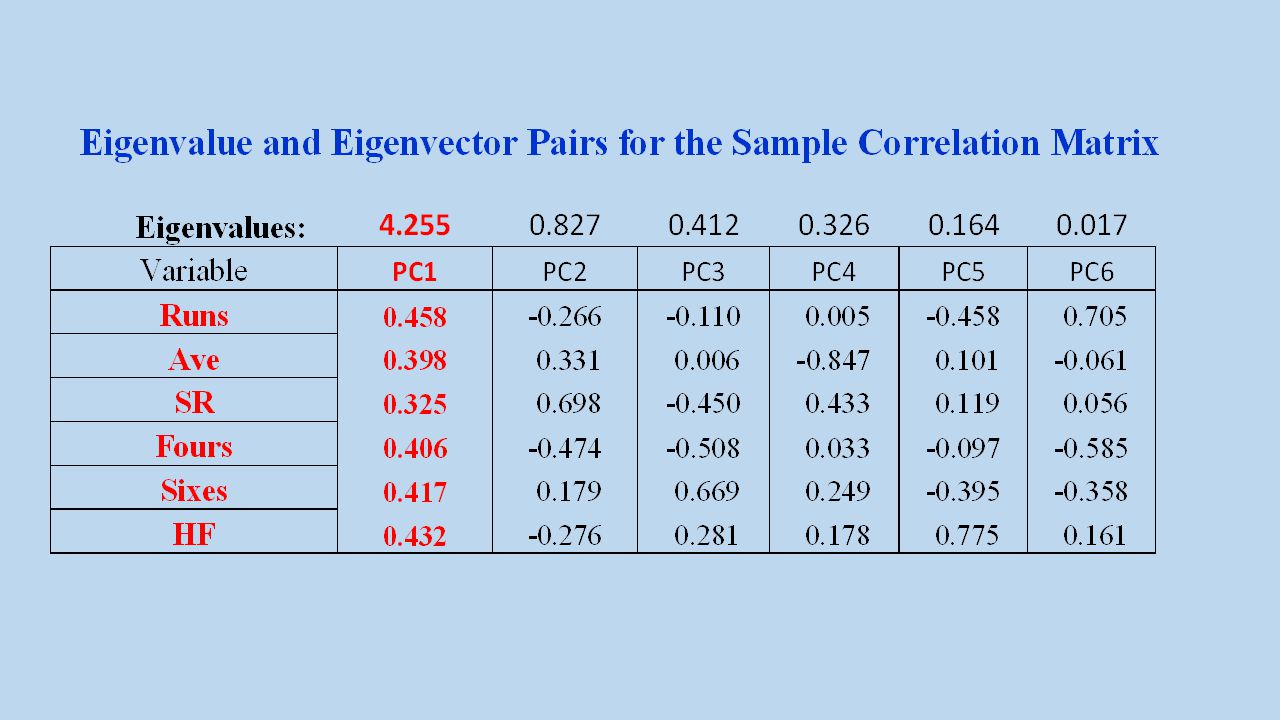
Ordered Eigenvalues and Percentages of Total Variability for Batsmen.

15
RANKING EQUATION FOR THE BATSMEN (First Principal Component)
")
16
BatsmanMatchesInningsRunsAveSRHundredsFiftiesFoursSixesHFL1L1 C.H. Gayle 151473361.08160.7417465998.47 G. Gambhir 17 59036.87143.5506641764.59 V. Sehwag 16 49533.00161.2305571954.12 S. Dhawan 15 56940.64129.6105581854.10 A.M. Rahane 16 56040.00129.3313731054.00 C.L. White 13 47943.54149.6805412053.88 R.G. Sharma 171643330.92126.613391852.90 K.P. Pietersen 8830561.00147.3411222032.86 A.B. de Villiers 161331939.87161.1103261532.31 F. du Plessis 131239833.16130.9203291732.11 Top Ten Batsmen for IPL 2012 (minimum 300 runs) using First Principal Component, L 1
 using First Principal Component, L 1.")
17
BatsmanRunsAveSR Ramakrishnan Score First PC Score (L 1 ) C.H. Gayle 73361.08160.7427.85 8.47 G. Gambhir 59036.87143.5520.99 4.59 K.P. Pietersen 30561.00147.3420.23 2.86 C.L. White 47943.54149.6820.08 3.88 S. Dhawan 56940.64129.6119.10 4.10 V. Sehwag 49533.00161.2317.70 4.12 F. du Plessis 39833.16130.9217.10 2.11 A.M. Rahane 56040.00129.3316.93 4.00 A.B. de Villiers 31939.87161.1116.58 2.31 S.P.D. Smith 36240.22135.5814.88 1.23 Top Ten Batsmen for IPL 2012 (minimum 300 runs) using Ramakrishnan ranking method along with First PC Score L 1
 using Ramakrishnan ranking method along with First PC Score L 1.")
Similar presentations


. Cricket, the Mote? Nice Try!>")


www.sify.com.>")